


Nagaland survey reports 16% unemployment, citing lack of skills and migration trends; officials call for stronger training policy.
Share
KOHIMA — Nagaland’s employment rate has been estimated at 83.92%, while the unemployment rate stands at 16.07%—a figure described as “quite high” for a state that recently ranked as the country’s third-most literate.
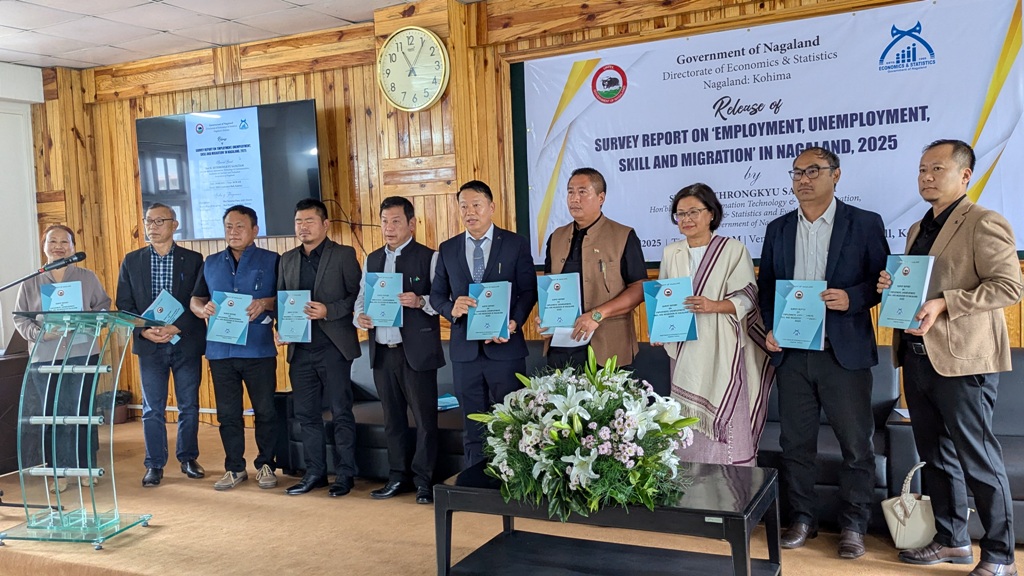
The findings are part of the Survey Report on Employment, Unemployment, Skill and Migration in Nagaland 2025, a first-of-its-kind initiative by the Directorate of Economics and Statistics (DES).
The report was formally released on Friday by Advisor for Information Technology & Communication, Economics & Statistics, and Evaluation, H Sethrongkyu Sangtam, in Kohima.
Presenting the report, DES director Neidilhou Keditsu said that most of the unemployed respondents cited unspecified “others” as the reason for unemployment (accounting for 59%). Strikingly, none cited “shutdown of production units” or “no financial need to work.”
Also read: Anganwadi workers in Nagaland left out of state support, says NPP
He suggested that the absence of industries and high dependency on others could explain this.
Meanwhile, 8% attributed unemployment to lack of opportunities in their area.
The survey covered 4,395 households—1,315 in urban areas and 3,080 in rural—with working-age members counted between 15 and 59 years.
It found that 24% of respondents were self-employed, 13% held salaried jobs (public and private), and 9% worked as casual wage labourers.
Employment rates were highest in Mon (91.08%) and Longleng (90.48%), followed by Wokha (89.35%).
Unemployment was highest in Phek (25%), Dimapur (21.57%), and Peren (19.11%). Self-employment was most prevalent in Zunheboto (40%) and lowest in Dimapur and Tuensang (14% each).
The Labour Force Participation Rate (LFPR) was estimated at 56%, peaking in Wokha (75%) and lowest in Tuensang (41%).
Income and expenditure
The survey placed average monthly household expenditure at INR 16,522, with a wide gap between the lowest (INR 1,133) and the highest (INR 3,61,647). Dimapur households reported the highest mean monthly expenditure (INR 22,716), followed by Kohima (INR 18,549). Longleng reported the lowest (INR 13,849).
“This data really shows the wide gap in income disparity in the state,” Keditsu remarked.
The report found that 26% of respondents had studied up to secondary school, 21% up to middle school, and 2% were illiterate. Alarmingly, 92% lacked technical or vocational training.
“This shows that the state faces an acute deficiency in skill development. More training institutes—both private and government—are required,” Keditsu said. IT emerged as the most common skill, reflecting its strong employability potential.
Job search efforts also appeared weak, with only 24% of respondents registered in the public employment exchange.
Further, 65% of those employed had no written job contracts, while 15% were unaware of their social security benefits.
A multinomial regression analysis indicated that individuals with moderate education had better chances of employment than the uneducated, though odds of employment declined at higher levels of education.
Those with formal vocational training were 46% more likely to secure salaried employment.
District-level data revealed Kiphire had the highest share of respondents without vocational training (98%), while Mokokchung reported the lowest (78%).
Migration trends
On migration, 55% of respondents had moved from rural to urban areas, 25% from rural to rural, 17% from urban to urban, and only 3% from urban to rural.
The main reasons cited for migration were “others” (35%), followed by employment in the public sector (27%), business (13%), marriage (13%), private sector jobs (7%), and education (5%).
At their place of origin, 80% of migrant respondents earned less than or equal to INR 10,000. After migration, 33% reported earning between INR 10,000 and 20,000.
Policy relevance
According to Keditsu, the survey was designed to assess human resource utilisation in Nagaland, evaluate determinants of employment/unemployment, and study migration patterns.
While data from newly created districts such as Shamator, Niuland, Chümoukedima, Tseminyu, and Meluri could not be taken separately, household samples from these areas were included under their parent districts.
He expressed hope that the findings would inform better policy solutions to tackle unemployment.
Releasing the report, Advisor Sethrongkyu described it as a much-needed publication that would serve as a foundation for labour policy and help harness Nagaland’s demographic dividend.
“The district-wise socio-economic data in the report will shed light on the unique challenges facing each district,” he said, expressing confidence that the report would enhance public discourse on employment.